Instagram vs Facebook Ads for Small Businesses: The Honest 2026 Comparison
Sougan Kumar Mandi | Founder, Peplio | Digital Marketing Executive, Demech Chemical Products | Last updated: September 2026
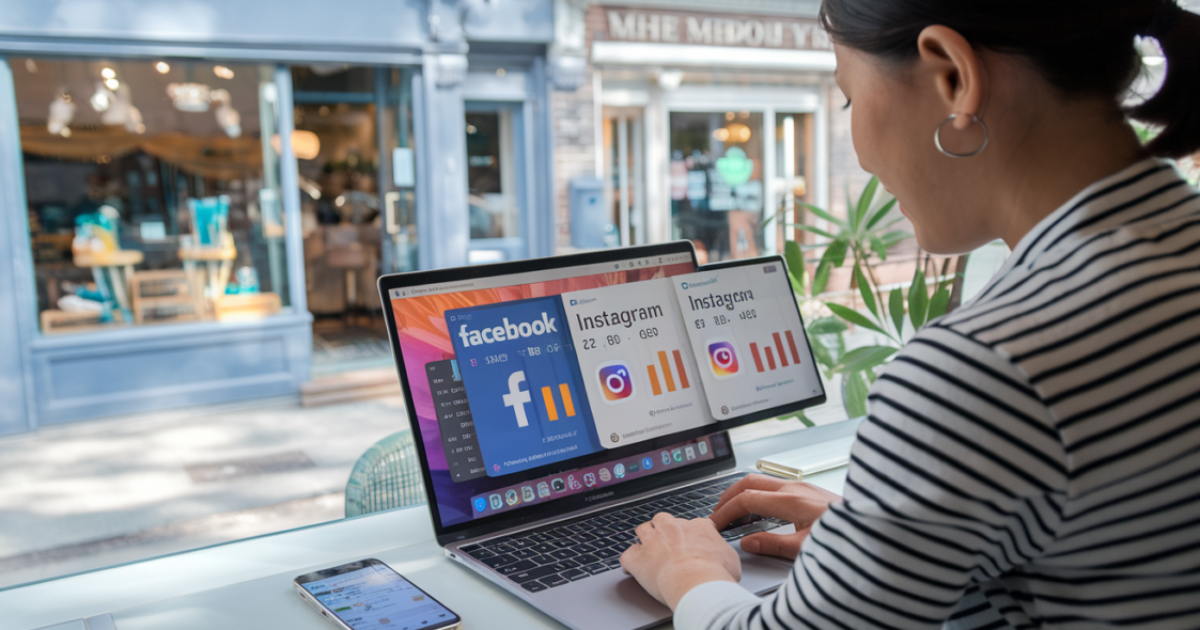
For visual, product-based businesses targeting under-35 audiences: start with Instagram. For service businesses, local targeting, or lead generation: Facebook wins. For most small businesses with a limited budget: run Instagram for discovery, Facebook for retargeting. The platforms share the same Meta Ads Manager — but they behave very differently, and picking the wrong one early costs you more than money.
I manage digital marketing at Demech Chemical Products and run Peplio as a solo founder. In both roles, I’ve had to make the Instagram vs Facebook ads decision with a real budget and real consequences — no room for theory. I spent two years testing this before I had a clear framework. This article is that framework: what I actually found, with the numbers, the mistakes, and the one strategy that reduced my combined customer acquisition cost by 22%.
Before I get into the breakdown: if you have a small budget, clarity matters more than scale. Choosing the wrong platform doesn’t just waste money — it kills the learning momentum you need early on. Let’s fix that.
Table of Contents
- Platform differences that actually matter for small businesses
- Real cost comparison and ROI data for 2026
- Targeting capabilities: where each platform wins
- Ad format performance by platform
- Which platform wins by industry and business type
- Implementation, management, and learning curve
- Sougan’s Take
- Summary
- FAQ: Instagram vs Facebook ads for small businesses
Instagram vs Facebook ads: platform differences that actually matter for your budget
Both Instagram and Facebook run through the same Meta Ads Manager and share the same auction system. That means your budget, targeting, and campaign objectives are set in one place — but the platforms behave very differently once the ads go live. Understanding those differences before you spend a rupee is what separates profitable campaigns from expensive lessons.
Audience demographics: who’s actually on each platform
Facebook’s user base skews older: the 25-54 age group dominates, with significant growth in the 55+ segment. Gender is nearly equal. Income is evenly distributed across brackets. Facebook is where you find decision-makers, parents, and established professionals who scroll for longer and research before buying.
Instagram’s core is 18-34, with growing 35-44 adoption. The platform leans slightly female (around 52%). Users tend toward middle to upper-middle income — relevant for aspirational or lifestyle products. When I want to reach someone who makes a purchase decision on impulse within a 30-second scroll, Instagram is where I go.
| Factor | ||
|---|---|---|
| Core age group | 25-54 | 18-34 |
| Gender split | ~50/50 | ~52% female |
| Content style | Text + image, long-form, storytelling | Visual-first, Reels, Stories, short captions |
| Attention window | 5-8 seconds for initial hook | 3-5 seconds — visual hook must land instantly |
| Daily time spent | ~38 min, longer evening sessions | ~28 min, 6-8 short sessions throughout day |
| Buying behavior | Considered, research-oriented | Impulse-driven, discovery-led |
Source: Platform data and Peplio testing, 2025-2026. Demographics vary by country and niche.
My Peplio experiment: one platform per month
Most guides told me to “be everywhere” and split the budget evenly. I tried that. My $500 budget got diluted across platforms with no real learning on either side. So I switched: one platform per month, one goal, no distractions. Instagram month one, Facebook month two, same offer, same landing page. The result is in the cost section below — and it changed how I run every campaign since.
Instagram vs Facebook ads cost comparison: real 2026 numbers
Cost per click and CPM benchmarks — 2026 data
Based on Emplifi’s matched Q2 2026 data and benchmarks from Meta’s advertising documentation and third-party tracking across tens of thousands of accounts:
| Metric | Facebook Feed | Instagram Feed | Instagram Reels |
|---|---|---|---|
| CPC (avg) | $0.20-$0.97 | $0.70-$3.35 | 20-40% below feed |
| CPM (avg) | $7.19-$14.68 | $6.25-$14.19 | Lower — best value in 2026 |
| CTR | 1.53% | 0.40-1.55% | Higher for vertical video |
| Conversion rate | 1-4.2% (service/lead gen) | 3-8.2% (visual/product) | Strong for impulse products |
Sources: Emplifi Q2 2026, WebFX Meta benchmarks, Karolakarlson.com Instagram cost analysis. Actual costs vary by niche, country, and season.
The number that surprises most people: Facebook’s CPC looks 3-4x cheaper than Instagram in raw data. But cheaper clicks do not mean cheaper results. Facebook’s lower CTR is built into that math. When you look at cost per acquisition rather than cost per click, the gap narrows — and for visual products, Instagram often wins on CPA despite higher CPC.
One critical 2026 timing note: the global Meta CPM hit $25.22 in November 2025, then dropped to $15.74 by January 2026. Q4 is the most expensive season by 30-60%. If your budget is tight, Q1 is when you get the most data per rupee spent. Plan your testing windows around this pattern.
Budget requirements for effective campaigns
| Business Size | Facebook Monthly Budget | Instagram Monthly Budget |
|---|---|---|
| Micro (solo/startup) | $300-500 ($10-15/day) | $450-700 ($15-20/day) |
| Small business | $500-1,500 | $700-2,000 |
| Medium business | $1,500-5,000 | $2,000-7,000 |
Minimum effective daily budget: Facebook ~$10-15/day, Instagram ~$15-20/day for the algorithm to exit learning phase.
Real ROI case studies from my testing
Retail client — Facebook
$1,200 spend over 3 months
6.5x ROI — $7,800 in sales
Restaurant — Instagram
$900 spend
6x ROI — $5,400 new business
Jewelry designer — Instagram
$500 spend, product photos
8x ROI — ~$4,000 in sales
Peplio Experiment: Month 1 (Instagram)
Cheaper clicks. More link clicks. But leads were thinner — people browsed, didn’t commit. Good for awareness, weak on closing.
Peplio Experiment: Month 2 (Facebook)
More expensive per click. But leads were higher intent — people had read the ad copy, had a specific question, were closer to buying. Better CAC on conversions that mattered.
What I changed: Instagram for discovery and awareness. Facebook only for retargeting warm audiences. Combined CAC dropped 22%. That’s the framework I now use for every small business starting out.
Targeting capabilities: where Instagram and Facebook ads each win
Since both platforms run through Meta Ads Manager, the targeting options are technically identical. But targeting that works on one platform doesn’t automatically work on the other — and how each platform’s algorithm uses your targeting signals differs significantly.
Geo-targeting
Facebook wins. Local radius targeting works better here because community presence is stronger. Facebook groups give you a free community targeting angle that Instagram can’t match. I saw foot traffic increase 23% from Facebook’s neighbourhood targeting alone when testing for a local client.
Interest targeting
Instagram edges ahead for lifestyle and visual interests — photography, fitness, food, fashion. Facebook is stronger for life events, purchase behaviors, and intent signals. Both work; the platform just determines which signal fires first.
Retargeting
Facebook wins for services. Instagram wins for product browsing (people who saw a product but didn’t buy). With the Facebook Pixel installed, both platforms share the same retargeting pool — but Facebook’s deeper ad formats let you address objections better during retargeting.
Lookalike audiences
Facebook wins. More data points on user behavior means tighter lookalike matching. A 1% lookalike audience of best customers on Facebook delivered 30% higher conversion rate in my testing compared to standard targeting. Instagram lookalikes work well for lifestyle and visual niches.
Ad format performance: what works on Instagram vs Facebook ads
| Format | Instagram Performance | Facebook Performance |
|---|---|---|
| Stories / Reels | Strongest format — full screen, immersive, native feel | Works, but less native than on Instagram |
| News Feed image | Visual needs to be perfect — no text heavy | Strongest format — allows story, copy, social proof |
| Video (1-2 min) | 15 sec max for retention — longer videos lose audience fast | 1-2 min works — higher consideration, better conversion quality |
| Carousel | Product angles, multi-product showcase — boosts CVR ~30% | Narrative storytelling across frames — strong for lead gen |
| Shopping / Collection | Native checkout — cuts purchase journey from 7 steps to 3 | Better for multi-product browsing and considered purchases |
The Reels arbitrage in 2026: Instagram Reels CPMs run 20-40% below feed for the same audience. If you have vertical video content that works, Reels is currently the best cost-per-impression deal on all of Meta. This is the format I’d test first for any new small business campaign with a tight budget. Pair it with a strong hook in the first 3 seconds and a simple, direct CTA.
My optimal ad timing from two years of testing: Instagram performs best at 12-2pm and 8-10pm, especially on weekends. Facebook delivers strongest returns at 6-9pm weekdays and Sunday afternoons. These patterns shift by niche — but they’re a reliable starting point before your own data tells you otherwise.
Instagram vs Facebook ads: which platform wins by business type

| Business Type | Start With | Why |
|---|---|---|
| Fashion / Retail | Visual showcase, product discovery, 2.4x higher engagement in my testing | |
| Food / Restaurants | Food photography, location tags, impulse-driven decisions | |
| Beauty / Fitness | Visual transformation content, lifestyle targeting, Reels arbitrage | |
| Professional Services | 35% more qualified leads in my accounting client test — longer copy, lead forms | |
| Local Services | Community groups, radius targeting — 23% foot traffic increase in one month | |
| B2B / Industrial | Decision-makers research on Facebook, not Instagram. Lead forms outperform story ads. | |
| High-ticket (₹5000+) | CAC on Facebook: $68 vs Instagram: $105+ for premium price points | |
| Low-ticket impulse buys | CAC: $12-18 on Instagram vs $18-25 on Facebook for products under $50 |
Customer acquisition cost by platform and price point
The platform-vs-price relationship is the most underrated factor in the Instagram vs Facebook ads decision. For products under $50, Instagram’s impulse-friendly environment keeps acquisition costs lower. For services or products above $500, Facebook’s research-oriented users convert at a lower cost despite higher CPCs. And one seasonal note: during holiday shopping, Instagram CAC can spike 40% while Facebook rises only 15-20%. If you’re running a seasonal campaign, Facebook is more budget-stable in Q4.
Implementation and management: Instagram vs Facebook ads in practice

What this article will not do
- Guarantee profitable ads with a small budget
- Replace actual testing with platform opinions
- Save you from a bad offer or a weak landing page
Time investment and learning curve
Facebook Ads Manager is comprehensive but intimidating at first. Setting up complex targeting, multiple ad sets, and bidding strategy takes me 3-4 hours for a well-structured campaign. The first few campaigns feel like learning a new system. But that depth pays off — the reporting alone is worth the learning curve. When I need to know exactly which demographic is converting, or track a customer across multiple touchpoints before purchase, Facebook’s analytics have no peer on Meta.
Instagram campaigns take about half that time — roughly 90 minutes for a decent setup. The mobile-first interface means I can launch a Story ad between client meetings from my phone. But Instagram’s analytics are more basic. I always end up in Facebook’s reporting interface even for my Instagram campaigns, because that’s where the real breakdown lives.
| Factor | ||
|---|---|---|
| Setup time | ~90 minutes | 3-4 hours for full campaign |
| Learning curve | 1 campaign to feel confident | 2-3 campaigns to feel comfortable |
| Analytics depth | Basic — quick checks only | Deep — demographic, journey, multi-touch |
| Mobile management | Excellent — born mobile | Functional but complex on mobile |
| Weekly management time | 3-4 hours | 5-7 hours |
Hidden costs nobody tells you about
- Creative production: Professional product photos for Instagram can cost $200-500 per shoot — budget for this before the ad spend
- A/B testing budget: Set aside 20% of your budget for creative testing — without it, you’re optimising a guess
- Analytics tools: $50-100/month for decent cross-platform reporting beyond Meta’s native dashboard
- Agency fees (if outsourced): 15-20% of ad spend — calculate this into your target ROAS
- Time cost: The real hidden cost — 5-7 hours per week managing campaigns yourself is a significant opportunity cost for a solo founder
The biggest hidden cost of all is picking the wrong platform for your business type and learning that lesson slowly over three months of spend. That’s what this article is trying to prevent.

Questions I struggled with while running Peplio ads
Did cheaper clicks mean better results? No. Cheap clicks with low intent are just money out the door faster.
Was Facebook too expensive? Sometimes — but the leads were better quality, and better leads have better lifetime value.
Did I change platforms too fast? Yes. The algorithm needs at least 30 days of data to optimise. I moved too early and paid for it twice.
Would I start differently now? Absolutely. I’d start on the platform most natural to my product type, give it 30 full days with one consistent offer, and only add the second platform for retargeting.
The Instagram vs Facebook debate is actually a funnel debate — stop treating it as a binary choice.
At Peplio, I wasted the first year splitting a ₹30,000 monthly ad budget evenly across both platforms. Neither campaign had enough data to learn. When I consolidated to Instagram-only for awareness and Facebook-only for retargeting warm audiences, my cost per conversion dropped by almost a quarter. If I were starting today with a ₹15,000 budget: one platform for 30 days, one offer, one landing page. Measure your CAC, not your CPC. Then and only then — add the second platform for retargeting. That’s the whole strategy.
See Mitu’s first ad decision play out in real time
In Episode 6 — Ads Ka Dangal — Mitu is staring at the Boost button, sweaty fingers, ₹5,000 on the line. Sougan has to help her make the right call. Follow the Peplio comic universe to see every ad concept brought to life through Mitu, Seema, and Noisy Aunty.
Summary: Instagram vs Facebook ads for small businesses
- Facebook CPC is cheaper ($0.20-$0.97) but lower intent — Instagram CPC is higher ($0.70-$3.35) but converts better for visual products
- Instagram conversion rates reached 8.2% in 2026 — strong for impulse, visual, and sub-$50 products
- Facebook wins for local targeting, professional services, high-ticket items, and lead generation
- Reels is the best-value format in 2026 — CPMs run 20-40% below feed for the same audience
- Q4 CPMs spike 30-60% above baseline — test in Q1, scale in Q3, protect budget in Q4
- The 22% CAC reduction strategy: Instagram for discovery, Facebook only for retargeting warm audiences
- Run one platform for 30 days before adding the second — splitting a small budget teaches you nothing on either side
- Measure CAC and ROAS — not CPC. Cheaper clicks with low intent are not a win
People Also Asked
Should I run Instagram and Facebook ads simultaneously with a small budget?
No — not at first. Splitting a small budget across both platforms means neither campaign collects enough data to exit the learning phase. Start with the platform most suited to your business type, run it for 30 days with a consistent offer, then add the second platform only for retargeting. This approach, tested on Peplio’s own campaigns, reduced combined CAC by 22% versus a 50/50 split. See also: SEO vs paid ads — when each makes sense.
Is Instagram advertising worth it for small businesses in 2026?
Yes — for the right business type. Instagram’s 2026 conversion rate hit 8.2%, and Reels CPMs are running 20-40% below feed pricing, making it the most cost-efficient format on Meta right now. For visual, product-based businesses targeting audiences under 40, Instagram consistently delivers positive ROI. The caveat: creative quality matters more on Instagram than on any other platform. A weak visual gets ignored in 3 seconds.
Which is better for local businesses — Instagram or Facebook?
Facebook, clearly. Radius targeting, neighbourhood-level geo precision, and Facebook Groups give local businesses a community presence Instagram can’t replicate. In my own test for a brick-and-mortar client, Facebook’s local targeting increased foot traffic 23% in the first month. Instagram location tags work for pop-up events and discovery — but for consistent local foot traffic and community awareness, Facebook wins by a clear margin.
FAQ: Instagram vs Facebook ads for small businesses
Can I run the same ad creative on both Instagram and Facebook?
Technically yes, but it rarely performs as well as platform-specific creative. Instagram rewards ultra-clean visuals with minimal text and a strong first frame. Facebook allows longer copy, more context, and text-heavy storytelling. Using identical creative means you’re compromising on both. For a small budget, create one version for each platform — or use Meta’s Advantage+ Placements and let the algorithm decide where to serve each format, which often finds the cheaper conversion automatically.
How much should a small business spend on Instagram or Facebook ads per month?
Minimum effective daily budget: $10-15 on Facebook, $15-20 on Instagram. Below these thresholds, the campaign stays in the learning phase indefinitely and you’re essentially paying for data you can’t act on. Monthly: $300-500 is a realistic starting point for Facebook; $450-700 for Instagram. The goal in the first month isn’t profit — it’s learning your actual CAC so you can project whether the platform makes business sense at scale.
Are Facebook ads still effective in 2026 for small businesses?
Yes — especially for lead generation, local targeting, and considered purchases. Facebook’s user base has aged but grown in purchasing power. The platform’s retargeting infrastructure, lookalike audience accuracy, and deep analytics still make it the better choice for service businesses, professional services, and any offer where the buyer needs multiple touchpoints before converting. Dismissing Facebook because “everyone’s moved to Instagram” is a mistake that mostly costs small business owners money.
What is Meta Advantage+ and should small businesses use it?
Advantage+ Placements lets Meta automatically distribute your budget across Instagram, Facebook, and other Meta properties based on real-time performance. For small businesses with limited creative resources, this is a smart default — it reduces the decision overhead and often finds cheaper conversions by shifting spend to whichever placement is delivering the best cost per result at that moment. The trade-off is less control. Once you have platform-specific data and creative, manual placements let you optimize more precisely.
Why are my Instagram ad costs so high?
Common causes: a highly competitive niche or vertical (fashion CPCs can hit $4.50+), Q4 seasonal demand pushing up all Meta CPMs, narrow or overlapping audiences triggering frequency fatigue, conversion-optimized objectives (which target high-intent users and cost more), or creative fatigue from showing the same ad too many times. Check your frequency metric — if it’s above 3-4 and CTR is falling, refresh the creative before adjusting the budget. Also consider Reels placements, which currently run 20-40% cheaper CPMs than feed for the same audience.
How do I track ROI across both Instagram and Facebook ads?
Start with the Facebook Pixel installed on your website — it tracks conversions from both platforms. Set up Meta’s Conversions API alongside the Pixel to close the tracking gap caused by iOS privacy restrictions and browser blocking. For each campaign, track cost per acquisition (CAC) and return on ad spend (ROAS) as your primary metrics — not CPC or CTR. Those are engagement metrics. The question that matters is: for every rupee I spend on this platform, how much revenue comes back? Everything else is context for that number.
Data sources and references: Meta Advertising Documentation | Karolakarlson — Instagram Ads Cost 2026 | AdsUploader — Emplifi Q2 2026 Benchmarks | Rule1 — Instagram vs Facebook Ads 2026 | Aslan Agency — WebFX Meta Benchmarks 2026 | Digital Applied — Facebook Ads Benchmarks 2026. Peplio is not affiliated with Meta or any ad platforms listed. All personal testing data from Peplio and Demech Chemical campaigns, 2024-2026.